Supply and Demand, Revisited
Hector McNeill1
SEEL
Supply and demand, it would seem, is the explanation of everything that happens in an economy. But it is notable that few dwell on where supply and demand "come from". Even Alfred Marshall stated, "We might as well reasonably dispute whether it is the upper or under blade of a pair of scissors that cuts a piece of paper, as whether value is governed by demand or supply."
This completely overlooks the motivation and value gained by the person wielding the pair of scissors. Invariably only one person handles a pair of scissors at a time.
The origin of supply and demand as a concept or model is linked to those who initially referred to this concept and set out an explanation. However, a second, more important issue, is to understand why this incorrect model of market dynamics distorts economic policies.
|
The origins of the supply and demand conceptJohn Locke is considered to have referred to the notion of supply and demand in his publication,
"Some Considerations on the Consequences of the Lowering of Interest and the Raising of the Value of Money" (1691). His analysis of interest rates in 17th-century England.

Locke |
He described the desire by merchants who wanted the government to lower the cap on interest rates charged by private lenders. Their motivation was for people to be able to borrow more money and purchase more goods. Locke favoured a free setting of interest rates by the market economy because those set under government regulation could have unintended consequences.
Steuart |
Locke argued that if the lending industry were left alone, interest rates would regulate themselves and he wrote that,
"The price of any commodity rises or falls, by the proportion of the number of buyers and sellers."The first appearance of the term "
supply and demand" in print came in the publication, "
Inquiry into the Principles of Political Economy" by Sir James Steuart in 1767. Steuart's analysis was directed at the impact of supply and demand on laborers. Steuart noted that when supply exceeded demand, prices were reduced leading to lower profits realized by merchants, thereby reducing feasible wage rates and resulting in unemployment.
Adam Smith's, "
The Wealth of Nations" published in 1776 described the operation markets as an "invisible hand" that guides the economy and transactions. Smith described a society where many people produce products that individuals find useful or they need so as to provide a supply that satisfies demand and supporting a development of the economy to benefit all.

Smith |
However, in 1803 Jean-Baptiste Say published his first version of,
Say |
"
A Treatise on Political Economy" which presented the clearest analysis up until that time but he made a clear distinction between a nebulous concept of "demand" and "consumption". In fact the sub-heading of his book was,
"The Production, Distribution and Consumption of Wealth." Say's position was quite subtle in that he introduced the question, where do all these goods and services transacted come from and where does the money come from to pay for them? To answer this question it is necessary to add time to the equation. Therefore, in general, goods and services cannot be paid for until they have been produced. This means, in general, that goods and services are produced and perfected in the expectation that they will be sold. The funds used to purchase this output will have flowed through the economy to those who are going to buy, largely members of the public who are employed by the companies producing the goods and services. Therefore in selecting the goods and services they wish to consume, so the markets serve the function of facilitating the transactions concerned. To understand this basic model it helps to look at primitive non cash based barter economy exchanges which can only occur when both goods in the exchange have been produced. The exchange value of each is estimated by the proportions of each exchanged in a transaction. The introduction of money meant that the matching of proportions of goods was replaced by unit prices quoted in currency units. However, this does not change the need for the seller to have produced goods and for the buyer having been paid a wage producing other goods or providing other services.

de Vieuzac |
Say's insight was very much related to the fact that he had a considerable experience in business and owned a spinning enterprise employing several hundred people located in Auchy-l�s-Hesdin in the Pas de Calais, in France.
Mercantile and shopkeeper perspectives began to dominate market activities separating the content between manufacturers and consumers. As a result, economic analysts began to overlook the time dimension to production and consumption to the money in people's pockets and "on the shelf items". In a statement designed to offend the French revolutionary Bertrand Bar�re de Vieuzac made a speech to the National Convention in 1794 in which he stated, �Let Pitt then boast of his victory to his nation of shopkeepers�. Later, during the Napoleonic wars, the
Jevons
Marshall |
British press attributed this phrase to �the French� or to Napoleon. Mercantilism involving the purchase and selling of goods produced by others was becoming the dominant activity in opening up world markets. It is therefore not surprising that supply and demand took on another form.
In 1870, Fleeming Jenkin published the essay
"On the Graphical Representation of the Laws of Supply and Demand and their Application to Labour" which contained the first known representation of the supply and demand curve as we know it today and he included analyses of the effects of changes in the location of the curves and equilibria and he used this to trace trade-offs related to welfare analysis, applied to the labour market, market operational periods and considerations of long run effects.
A supply and demand diagram transcribed from Marshall's original representation of Jevon's S-D representation 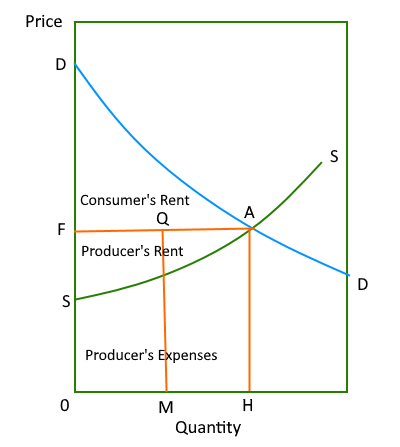 |
|
|
In 1890, Alfred Marshall's, "Principles of Economics" developed the supply-and-demand curve. Marshall introduced the concept of price elasticity of demand, Marshall reasoned that supply and demand, costs of production, and price elasticity all work together. Marshall's analysis appears to be correct but while providing a more detailed analysis of the production side of supply the origins of the income purchasing that supply were not referred to. This supply and demand diagram is now associated with policies that see demand as a factor that can be manipulated through policy instruments of interest rates, taxation, government debt and expenditure creating a debt-based addition of money (exogenous money) through money volume "management". As a result the equilibrium between income flows from wages and salaries paid and the levels of consumption of goods and services produced has been disrupted. As can be observed from Marshall's representation of supply and demand (see left) represents the state of affairs or an average or single producer supplying an average buyer or single buyer. In the actual production and consumption situation the range of producer costs and ability of consumers to purchase at any given price vary significantly. And yet, this single case graph is quite often used to represent a sector or even the economy. However, this so-called aggregate supply and demand model is unrealistic.
Defining a more realistic representation of supply and consumptionIf a market was a unique physical location in the centre of a country, where all buying and selling of a product took place, then there might be a way to determine an equilibrium or average price each day. In reality consumers and companies are distributed geographically and therefore the accessibility of products needs to be taken into account allowing for transport, the availability of a product in any location and the accessibility to the product price to people with different disposable incomes. The notion of market equilibrium is somewhat unrealistic also because what is not sold today will be sold tomorrow. The reason why some goods were not sold today could be because not enough people were purchasing that day.
Therefore, whereas in a single location it might be that all that was transported to the market was sold, "clearing the market" at some average price, does not mean demand was equal to supply because there could be people who turned up too late to get what they wanted and when no more was available. There is also the case that those with insufficient disposable income cannot afford the prices asked leading to supply not being equal to demand or consumption needs. Therefore the so-called equilibrium price is only stating that at that price so much was sold and the same quantity was purchased, however, this does not mean demand was equated with supply in the sense that the latent demand represented by those with inadequate income remains unsatisfied. The conventional supply and demand curves have no way to correlate these issues.
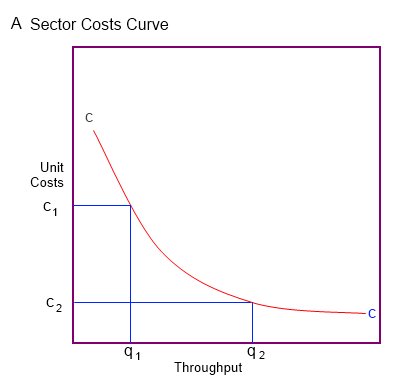
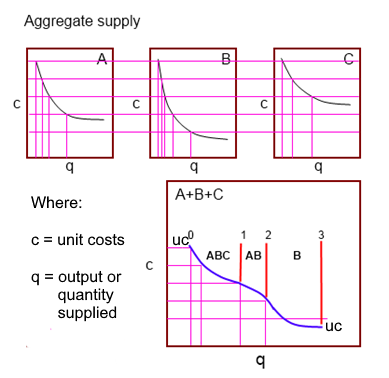
When it comes to understanding the factors that determine the dynamics of production and consumption it is necessary to take into account the unit costs of production which establish a lower boundary for prices and the price limits for consumers according to their income levels and disposable incomes. The diagram on the right represents the unit cost lines associated with the output of three companies, A, B and C that make up a sector and supply all goods sold. By combining their unit cost curves by across total output supplied it is possible to construct an aggregate supply curve expressed as a unit costs curve. This represents A + B + C as the blue line uc-uc.
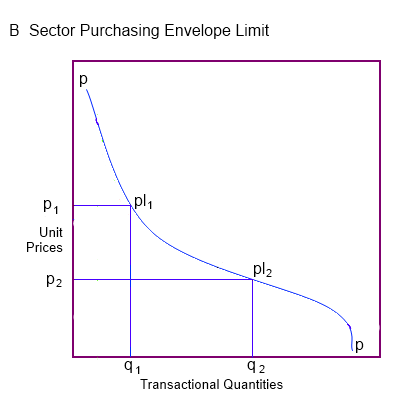
The sector transactional envelopeBelow is a sequence of graphs which starts with a smoothed out sector unit costs curve. The "affordable price" will vary with people's incomes and disposable incomes which vary from those with high income to those with low incomes. Therefore it is possible to construct a sector purchasing limit which establishes a line that represents the maximum unit price people within different income strata can afford to purchase the product. By superimposing the unit costs curve and the sector purchasing limit line associated with incomes, a "transactional envelope" is defined.
The transactional envelope is a probability function within which market transactions can occur with producers at least covering costs and consumers purchasing at prices they can afford.
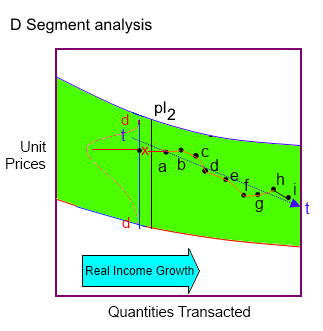
The movement of prices within the transactional envelope will depend upon buyer location, where transactions were closed between the unit cost and unit price lines as show in the segment of the transactional envelope to the right.
The price "walk" line a through to i, illustrates two things. One is that to expand sales unit prices need to fall and as prices fall the real incomes of all of the consumers rise. Thus real economic growth in real incomes arises as a result of unit price reductions. However, as prices approach the unit costs lines the
price elasticity of consumption (pEc) can secure a higher rate of market penetration but at lower marginal unit margins. Therefore, managers need to seek means of improving productivity to lower unit costs to as to be able to penetrate the market and sustain real profits from an enhanced income.
Productivity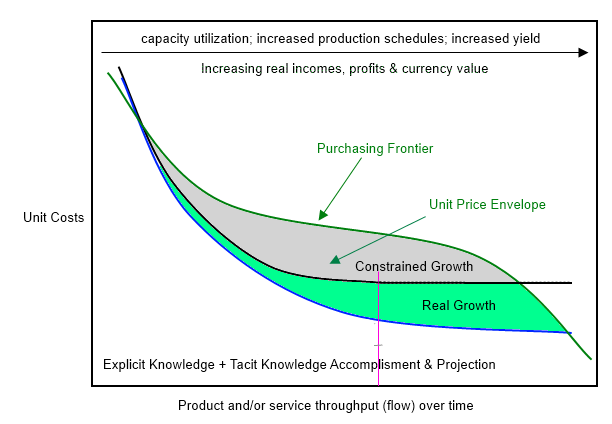
Between 60% and 80% of economic growth arises as a result of learning by doing. Thus the repetitive application of tasks results in rising competence (skill) or tacit knowledge and the observation and analysis of performance based on explicit knowledge, leading to better ways of accomplishing tasks or innovation. This composite process is known as the learning curve.
The result of learning is therefore less waste, completing tasks within a shorter period of time and often by making use of less resources. The most significant impact of this type of innovation is the reduction in unit costs. Therefore based on learning alone, the constraints that existed on the unit costs line are relaxed and the unit costs line falls leading to an expansion in the lower reaches of the transactional envelope as a new zone for potential real incomes growth. This is illustrated in the diagram on the left.
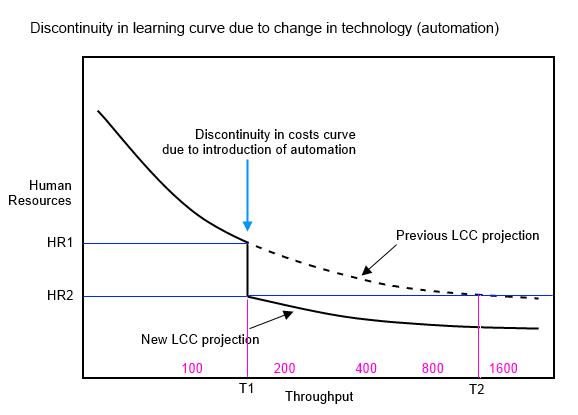
The impact of technology on the learning curve
Besides learning and the development of operational competence, the advance in technology contributes to even further improvements in productivity and reduction in unit costs. This can be a stepwise impact. For example the diagram on the right illustrates the introduction of a major advance in automation in lowering unit costs curve at a specific level of output from HRS to HRS. In this case the reduction is human resources input. Significant advances in automation for some aspects of tasks and quality control can improve process output yield and product quality as a stepwise impact.
The impact of learning on competence and technology is to lower the unit cost line of the transactional envelope opening up the ability to lower unit prices to promote generalized gains in real income (purchasing power) while maintaining the ability to gain compensatory margins in real terms. The impact on employment depends upon the ratio of human resources required in comparison with other inputs and the resulting scale of production. Thus increasing market penetration will normally result in less unemployment associated with automation. There are, however, instances and types of activity, where this is not true.
UnemploymentUnemployment associated with advances in automation is a real issue and there is a need for policy making to look at the means of increasing incentives so as to reduce these impacts while ensuring that real incomes are stabilized. This topic will be covered in a subsequent article.
1 Hector McNeill is the Director of SEEL-Systems Engineering Economics Lab.
All content on this site is subject to Copyright
All copyright is held by © Hector Wetherell McNeill (1975-2020) unless otherwise indicated