A Real Money Theory II
A note
Hector McNeill1
SEEL
This short note has been produced to summarize the reasons why the quantity theory of money (QTM), which has turned out to be unable to explain the impact of quantitative easing, is flawed.
This advances the former version by adding offshore monetary flows as an additional non-circulating funds category that reduces the impact of the monetary volume instrument.
|
Introduction
This note provides the final conclusion to three previous explorations:
McNeill, H. W., "A Real Theory of Money", Charter House Essays in Political Economy,
26 March, 2020, ISBN: 978-0-907833-30-7
McNeill, H. W., "A New Theory of Money", Charter House Essays in Political Economy,
03 May, 2020, ISBN: 978-0-907833-31-4
McNeill, H. W., "A Real Money Theory", Development Intelligence Organization,
July 2020, ISBN: 978-0-907833-32-1
|
These explorations were undertaken to unravel the inability of the quantity theory of money (QTM) equation to explain the results of quantitative easing.
The deterministic or functional relationships that relate money volumes and interest rates to price inflation do not reside within the QTM. This is why proponents of monetarism are unable to explain the mechanisms whereby money volumes and interest rates influence price levels
2.
Background
The quantity theory of money (QTM) is not a determinant model because it provides no functional components to represent the means whereby money volumes influence inflation. This is a logical consequence of inflation having no direct relationship to the volume of money or interest rates, as established by the Real Incomes Approach to Economics. The causes of inflation have been described in the 1981 paper in this series which was a reprint of the original, released in Rio de Janeiro, in 1976.
QTM limitations
The current formula for the QTM does not account for non-circulating money in the form of savings or asset holdings.
The common QTM equation was developed by Irving Fisher and others as:
M.V=P.T .... (i)
Where:
M is money supply;
V is velocity of circulation;
P is average price level;
T is volume of transactions of goods and services.
Quantitative easing
According to the QTM, increasing money volume increases P.T. Quantitative easing (QE) is an extreme form of “expansion” combining large M and a low, close to zero, base interest rates.
The “theory”, according to monetarists, was that QE would help banks build up their balance sheets following the 2008 crisis and investment and growth would take place with a probability of a tail end inflation which would be “controlled” by raising interest rates. The “logic” of this transition was the QTM.
However, the outcome has been insipid economic growth, falling investment and productivity and falling real incomes in the real productive economy.
The most direct outcome of QE has been a significant investment in assets (land, commodities, precious metals, share-buy backs) for speculative rather than productive reasons.
Clearly the QTM possesses no variable to explain this combination of circumstances and it is therefore of doubtful value as a transparent deterministic model.
The Cambridge equation
In the development of a more realistic substitute for the QTM, to reflect the actual outcomes of changes in money volumes, the Cambridge equation, based on contributions from Marshall, Pigou and Keynes, was a modification of the QTM where an additional determinant “k” was included to account for money held in reserve like savings as a non-circulating asset.
M.V = k. P. Y .... (ii)
On further examination this equation makes "k" a component of M but its functional relationship is not explicit. It appears as a multiplication whereas as an absolute sum it should be an additional component alongside (P.Y) so it should be added to (P.Y) to create a sum equal to M.
Therefore, from the standpoint of a decision analysis model, to be able to simulate and project the impact on real incomes, the appropriate format is of the form:
M.V = (P.Y) + k …. (iii)
This is because k reduces the “active” or “transactional funds” in the economy which are to be found in (P.Y).
In order to isolate and quantify the resulting real incomes element, the savings component needs to be transferred to the left of the equals sign as an amount that reduces M.V
M.V – k = (P.Y) …. (iv)
The real economy
The real economy is made up of the productive activities and the transactions between economic units within factor supply, produce and consumer markets. Savings and asset holding do not feature in this transactional economy and remain separate until used in liquid form, as cash, within the real economy. The real economy is essentially P.Y.
Quantitative easing and real incomes
Because of the inability of the QTM and the Cambridge equation to account for the outcomes of quantitative easing (QE) they have been modified to include an additional determinants, “a” for assets and "o" for offshore flows to reflect more faithfully the categories of non-circulating money.
Experience with QE demonstrates the flow of money into assets as well as offshore, has been a notable feature under this policy, causing a diaggregation in the macroeconomic model into self-contained capsules with no direct feedback into the economy (See:
"More to Say - Part 2: A century of encapsulation & economic disintegration 1920-2020" ). This has been associated with lower investment within the nation and depressed real incomes (wages) and stagnating prices.
Real Money Theory
A deterministic model of this relationship needs to replace the QTM, of the form:
M.V = (P.Y) + (a + k + o) …. (v)
or
M.V – (a + k + o) = P. Y .... (vi)
Where:
M is the quantity of money;
V is velocity of circulation;
P is the price level;
Y real income (substituting T in the Irving equation);
a is assets;
k is savings;
o is offshore investment.
As can be observed, by moving "a", "k" and "o" to the left, as a deduction from M.V, the very obvious depressive impact of rising asset holdings on the availability of money can be seen to reduce P.Y.
This has been the experience of countries who have applied QE, including the early introduction in Japan in the late 1980s. The universal impact has been depressed transactions and real incomes Y. This explains how the exogenous funds, that were not generated by the supply side (bank loans), were diverted in such a manner as to be inaccessible by the supply side for use as investment or transactions. With low interest rates, savings become less significant and assets become more significant. As a result, rather than see economic growth, in spite of close to zero interest rates, this has resulted in lower real incomes, lower substantive investment and deficient growth in productivity.
As is self-evident, the rise in exogenous money did not have any practical impact on "aggregate demand" for goods and services and even less so on real economic growth. In fact, the result of QE has been a decline in consumption and slow down driving V to probably less than unity (1.00) because a large proportion of funds are not in supply side circulation but circulate within a speculative inflationary capsule in assets. The close to zero interest rates have virtually eliminated interest bearing savings. So the Real Money Theory II identity approximates:
M - (a + o) = P.Y ...(vii)
Exogenous and endogenous dealingsThe Aggregate Demand Model (ADM) relies on the introduction of additional money beyond the current volume of nominal turnover of the real economy. This is an exogenous lever. The Production Accessibiity and Consumption Model is the real incomes framework where actions on the supply side determine the prices, investment from savings, payment of worker incomes and establishment of consumption levels. This is endogenous and real income growth depends upon rises in productivity and price setting rather than exogenous levers. The PAC model and logic arises from the Real Incomes Approach which is a supply side logic (see:
A clarification of the role and significance of supply side operations ). However, this should not be confused with "supply side economics" which is a fiscal variant of the ADM.
Asset holdings - leakage from exogenous finance (Exofin)
| 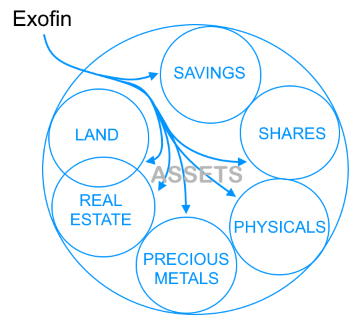
IMPACT
| UK onshore supply side production | Offshore |
- Loss of employment
- Lower prices imports
- Loss of productive investment
- Rise in income disparity
- Lower real wages
- Decline in national competitive status
- Fall in export competitiveness
|
- Rise in employment
- Rise in wages
- Profits circulate
- Reinvestment
- Investment flows back into selected onshore speculative opportunities in encapsulated markets
- Intensification of speculative price rises impacting costs of onshore production
- No investment flows into in supply side production
|
|
| Offshore investment - leakage from exogenous finance (Exofin)
| 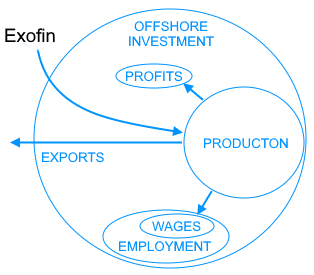
IMPACT
| Impacts on UK onshore supply side production | Offshore |
- Loss of employment
- Lower prices imports
- Loss of productive investment
- Rise in income disparity
- Lower real wages
- Rising speculative investment in encapsulated markets
|
- Rise in employment
- Rise in wages
- Profit circulate
- Reinvestment
- Rise in real incomes
- Investment opportunities in speculative encapsulated assets markets
|
|
|
Inflation
Inflation, under such a more transparent relationship can be seen to be singularly related to the direction that prices move (P). The average P for the whole economy is the mean of the aggregate prices of all economic units. These prices are set by each economic unit independently as the unique decision-making processes of each unit.
The QTM and the RMT do not possess any functional relationship to price movements or quantities of goods. This is because these depend upon price setting by economic units, the resulting revenues that are dependent on the price elasticity of consumption. The range of operational price elasticities of consumption are a function of consumer purchasing power which is determined by wage levels paid by these same units to their workforce (endogenous). In this Say model, inflation therefore has no direct connection to the volume of M (exogenous) or the price of M in the form of interest rates (exogenous).
In reality this means this RMT-II ends up stating at the core of the economy, the level of
consumption (M) is equal to the product of
average prices (P) and
number of units of goods and services (Y). This therefore provides an indication that the Say model represents a central equilbrium which has been seriously disturbed by excessive exogenous money injection (See:
"More to Say - Part 1 1920-1975, A note" ) .
The monetarists do not deal with physical, tangible relationships and for this reason their cop out is that "
Economics is not physics" and this is why their predictions are difficult to get right. However all of the supply side operates on the basis of physical principles and the quantities measure the relationships. However, monetary policy is an abstration which bears little relationship to the needs and operations in the real world and, for this reason, cannot predict with any precision, outcomes. In addition the logical and mathemtical competence of past monetarists has been lamentable. The QTM is one of the most outstanding examples.
Monetarism is not a sound basis for "managing" the economy and it is destabilizing and is a basic reason for the disintegration, not only of the UK but also of the world economy.
1 Hector McNeill is the Director of SEEL-Systems Engineering Economics Lab.
2 Monetarists are never able to provide a clear explanation of the functional mechanism of how money volumes influence inflation. Milton Friedman a leading proponent of this approach was equally unable and during the 1970s his default explanation was that "
it happens in the long run"; this is not an explanation of the mechanism. In any case, we are now beyond the long run after Friedman made this statement by some 30 years and it has turned out not to be the case. In 64 years ago Friedman also stated that as money volumes rise so does velocity (V) and, once again, this is not the case under QE.
Posted: 29th December, 2020.
Update: added more detail to impact tables, 24th January, 2021.
All content on this site is subject to Copyright
All copyright is held by © Hector Wetherell McNeill (1975-2020) unless otherwise indicated