The marginal propensity to consume is defined as the increase in consumption arising from an increase in disposable income. For example, if a household earns one extra £100 of disposable income, and the marginal propensity to consume is 0.80, then of that £100, the household will spend £80 and it is assumed, save £20. This assumes that the household cannot spend more than the extra £ without borrowing money.
The general formula is:
MPC = ΔC
ΔYwhere:
MPC is the marginal propensity to consume
ΔC is the increase in consumption
ΔY is the increase in disposable income.
The Income Multiplier (yM)The multiplier effect is the impact of the marginal propensity to consume on a chain of consumers who happen to receive their incomes from a chain of enterprises. There is a general formula that estimates the total additional expenditure or income arising from an initial expenditure. Thus the multiplier is given by the following formula:
Where:
yM is the multiplier (the number of times an initial outlay expands with consumption cycles)
MPC is the marginal propensity to consume
If an initial increase in nominal income is nYi the growth in GDP is yM(nYi).
The Real Income Multiplier (RyM) By substituting the MPC by pEc, (see
Price elasticity of consumption )the formula becomes a Real Incomes Multiplier:
Where
RIM is the Real Incomes Multiplier;
pEc is the price elasticity of consumption.
If an initial decrease unit prices dP the growth in real income is RIM(dP).
This changes the character of the marginal propensity to consume from being simply a quantiative measure of the rise in consumption associated with income to a measure of the rise in real income (purchasing power) associated with a reduction in unit prices. This has the result of giving a quantiative means of measuring the dynamics of real incomes in relation to unit prices.
Real Incomes analysisMost references to the yM and the MPC refer to situations where the measure of income is nominal incomes and prices are fixed.
Under the PACM Model of the economy neither nominal incomes nor prices are fixed. Indeed the model demonstrates the operation of real incomes policies in reducing unit prices and increasing real incomes even although nominal incomes might remain stable. It is therefore essential to trace the impacts of this tendency in prices and real incomes growth on the outcomes of the RIM and pEc.
Figure 1 shows two diagrams A and B. These are identical except that B traces a stepwise impact of price reductions on real income levels. Thus the movements in price-setting from point p to q and then to r representing progressive price reductions, that is, from a unit price of 1.00 to 0.50 ends up doubling the real income. Both A and B show the general relationships between real incomes and nominal incomes and unit prices plotted along the horizontal axis. The main point to note is that real incomes can be doubled and move from point a to point d by doubling nominal incomes. We all know that this state of affairs is very difficult to achieve within a short period. However, if unit prices are gradually reduced as a result of innovation and increasing productivity, the state of the economy or a sector can move from point a to point d as shown in B. Naturally, as productivity increases are realized unit pries would decline in a stepwise fashion so eventually point b is reached with the result that real incomes are doubled.
Figure 1
Nominal Income, Unit Prices and Real IncomesA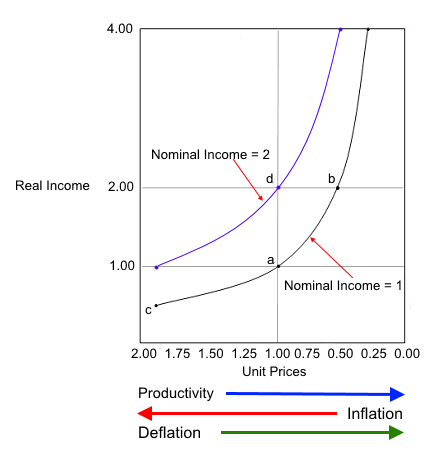 | B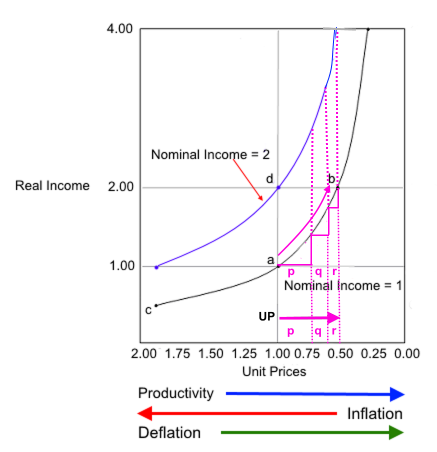 |
John Maynard Keynes, assumed that the marginal propensity to consume (see box on right) is less than one (<1.00). In his Book III Chapter 10 of The General Theory of Employment, Interest and Money (1936) he wrote:
"If the Treasury were to fill old bottles with banknotes, bury them at suitable depths in disused coal mines which are then filled up to the surface with town rubbish, and leave it to private enterprise on well-tried principles of laissez-faire to dig the notes up again (the right to do so being obtained, of course, by tendering for leases of the note-bearing territory), there need be no more unemployment and, with the help of the repercussions, the real income of the community, and its capital wealth also, would probably become a good deal greater than it actually is. It would, indeed, be more sensible to build houses and the like; but if there are political and practical difficulties in the way of this, the above would be better than nothing." |
However, as can readily be appreciated, this is only part of the story. Keynes, like his brethren in the area of monetary management, said close to nothing on the sources of economic growth when as we now know some 60% can be tied to productivity increases arising from innovation that itself is made possible as the result of accumulated experience in the application of technologies, human techniques and the accumulation of explicit and tacit knowledge (See:
Tacit & explicit knowledge).
The over-riding impact of productivity is that it enables unit prices of output to be reduced and this results in a real income effect created by rises in the purchasing power of the currency as illustrated in Figure 1. Productivity increases have a dynamics, that is, it takes time to achieve gains in productivity (Figure 1 part B). This period of rising real incomes resulting from lower unit prices has a significant impact on the multiplier. During this period lower unit prices can result in the MPC rising in accord with the PAC model (see
"The PAC Model of the Economy") to a magnitude that is equivalent to more than unity (>1.00) when compared with the state of affairs with stable nominal income or rising unit prices.
The magnitude of the multiplier depends upon the price elasticity of consumption of products and services associated with unit price declines.
Conventional policies do not make use of any policy instruments designed to produce a positive incentive for increased productivity and unit price declines so the Keynesian assumptions that the MPC remains less than one (<1.00) prevail in policy designs. This results in a lower rate of take up of products and services associated with gains in nominal disposable incomes. It should be added that disposable incomes need to battle with the devaluation of the currency imposed by monetary policies of inflation targets that are positive, for example the target inflation rate of 2%. This is equivalent to a greater than 18% devaluation and decline in real incomes each decade. So to remain in in the same place producivity needs to rise by that amount also. This passive policy mix is no formula for economic growth because it depresses the multiplier. This is because the devaluation of the currency reduced purchasing power which reduces real incomes lowering the the multiplier effect of any increases in nominal income.
Real incomes policyThe emphasis of the Real Incomes Approach, in the form of Price Performance Policy, is to stabilize or increase real incomes through enhanced productivity to increase the level of price competitivity including lowering unit prices. This has the effect of raising consumption so as to intensify the impact of the MPC and, in particular, increasing the rate of dissemination of economic growth through an enhanced multiplier.
Non-Inflationary GrowthA declared objective of real incomes policy is to contain inflation and promote real incomes through productivity and lower unit prices. Inflation is contained via supply side moderation of the PPR (see:
"The price performance ratio") and by company managers lowering the PPLs they need to pay; even reducing these to zero (see
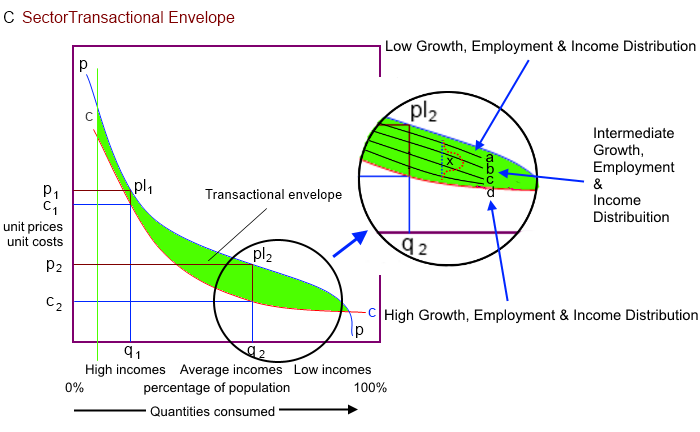
"The price performance levy"). In terms of the transactional envelope (see
"The PAC Model of the Economy") the multiplier effect can be traced in the form of price boundaries as shown in Figure 2. Thus the price line "a" is at the high end of the distribution "x" while the price line "d" is at the low end. Price line "a" will be associated with lower pEc and therefore lower RyM while price line "d" will be associated with a higher pEc and higher RyM. This has significant results.
- the growth rate in real incomes associated with higher prices is lower
- the growth rate in real incomes associated with lower price is higher
However,
in both cases inflation is contained.
Figure 2
The Real Growth Multiplier (RGM)
The impact of higher or lower unit price trajectories (a, b, c & d) on the real income multiplier & economic growth
 The generation of employment
With higher multipliers any slack in the capacity of the productive sectors will be taken up and a point will be reached where it is necessary to employ more people to satisfy the increases in consumption arising from the growth in real incomes resulting from price competitivity. As a result the growth in real incomes not only penetrates all income categories it also results in those who were unemployed gaining higher real incomes as a result of gainful employment.
The impact of the Real Growth Multiplier on employment naturally depends upon the performance of price setting and the elasticity of consumption for different products and services. Each product and service has a specific production function, that is, they combine different proportions of the factors of equipment and labour capacity. At first an increase in production takes up slack in equipment and the workforce and then once full capacity is reached, a point where overhead costs are minimized, further expansion in capacity will be achieved by taking on more labour and investment in capital equipment. Figure 3 shows possible factor distributions for production functions producing 100 and 150 units of output each day. Where there is a high proportion of capital equipment in comparison with labour the production function is considered to be "capital intensive" and where more labour is used then "labour intensive". When considering how to move from 100 units of output to 160 units of output, a production system, represented by point "b", can move in several directions
2, for example to point "d" using more capital equipment and automation, to an intermediate position "e" or by simply taking on more labour to arrive at point "f".
Figure 3
| 
Capital Intensive | 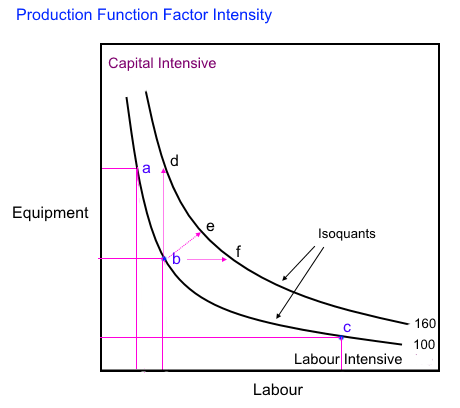 | 
Labour Intensive |
The actual expansion in employment depends upon the technological factor intensity applied as a result of decisions for expansion in the light of costs and the actual rise in consumption of output according to unit prices. Where expansion involves more capital intensity then the numbers employed by companies manufacturing the equipment concerned would normally increase and in association with an ability to raise wages. Less capital intensive and more labour intensive technolcogical investment would raise emplotment more.
Where does the impulse for growth come from?One of the interesting issues when MPC and the multiplier is discussed is that quite often no mention is made of where the impulse for growth comes from. How, for example, does the increase in nominal incomes appear?
Under conventional policies we know that this is attempted by applying the conventional demand analysis based on the assumptions surrounding the Aggregate Demand Model (ADM). The track record demonstrates a problem of traction and effectiveness of "growth policies" that have problems trading off inflation and growth or preventing low interest situations from being associated with the diversion of money into assets as opposed to productivity-enhancing investment to lower unit prices. On the other hand, Price Performance Policy provides a direct and positive incentive for firms to invest and lower unit prices because of an immediate compensation in the form of a lower PPL and bonuses. This results in an immediate lowering of unit prices and enhanced real incomes as illustrated by the stepwise progression in Figure 1 B with movement, for example, by the increments "p", "q" and "r". Figure 2 shows these relationships in terms of the PAC Model transactional envelope. Thus the impulse for growth and higher employment is more effectively achieved through a policy that provides incentives that support the initiative of economic unit management and workforces. This to a large degree negates several aspects of the so-called stages of economic growth model
3
1 Hector McNeill is director of SEEL-Systems Engineering Economics Lab
2 The movement across or along isoquants (lines showing the coordinates of factor combinations that have the same quantity of output) is not always as plastic or smooth since sometimes capital equipment is only produced according to fixed maximum capacities with no intermediate capacities. This causes discontinuities in isoquants. To achieve intermediate throughput can mean under-utilization of full capacity and this has cost implications.
3 For example: W. W. Rostow's
"Stages of Economic Growth - A Non Communist Manifesto", Cambridge University Press, 1960. This presented five steps through which all countries must pass to become developed: 1) traditional society, 2) preconditions to take-off, 3) take-off, 4) drive to maturity, and 5) age of high mass consumption
Updated: 24th June, 2015: Expanded section entitled "The generation of employment" and added Figure 3.
Updated: 31st August, 2015: Corrected sections that escaped spell checker and grammar check; additon of clarity; sense maintained.
Updated: 19 June 2020: Added RyM and pEc and explanations; sense maintained.
All content on this site is subject to Copyright
All copyright is held by © Hector Wetherell McNeill (1975-2015) unless otherwise indicated