The real incomes and investment trap
Hector McNeill1
SEEL
QE has pushed many share prices to end up with price-earnings ratios of in excess of 50. This is a nominal return of 2%. Monetary policy, apparently is aiming to raise inflation above 2%. This can only result in shares providing no real return at all. The problem is that there are no policy instruments in the government's toolkit to correct this policy-imposed trend. The levels of real investment in the economy are evaporating and, with this, any chance to recover real incomes. This policy-induced trend cannot continue.
This note explains this issue and how, in 1975, real incomes policy was initated to identify ways to avoid this sort of development. Even then it was self-evident that the state of affairs was, first of all, exacerbated by an emphasis of monetary instruments to address the slumpflation crisis. The post-1975 period saw supply side economics introduced and fail, largely because it isn't supply side at all. The main problem was widespread financial deregulation. This exacerbated the state of affairs and QE continues this destructive trend.
|
BackgroundAs a backdrop to this short article it is worth looking at a graph recently published in a RAND Corporation Working Paper entitled,
"Trends in Income From 1975 to 2018" covering the US statistics and prepared by Carter C. Price and Kathryn A. Edwards of RAND Education and Labor, WR-A516-1, September 2020
This RAND analysis in reality doesn't add much beyond a lecture delivered by Bill Clinton to Georgetown University, six years ago, on 1st May, 2014 (See,
Some evidence on the failure of supply side economics) largely because they both used the same data sources.
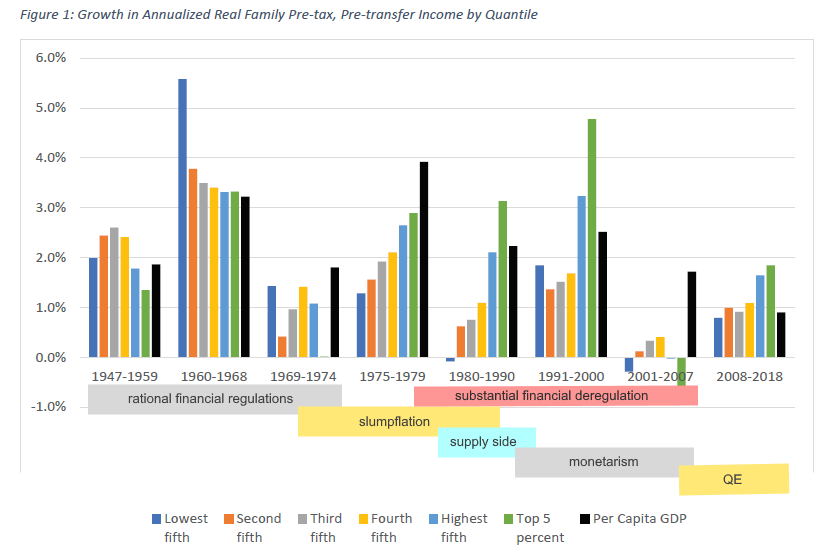
Based on RAND Corporation Working Paper WRA516-1 with overlay of relevant period references (SEEL). |
Real incomes disparityThe total disaster zone of post-2000 shows that in the USA, like here in the UK, follows a long period of increasing real incomes disparity as from 1975. The period of rapid gains in real income as well as declining disparity occurred as in the UK, as described by Robin Mattews' analysis of the UK economy between 1945 and 1965 when financial regulations were more rational and effective. As observed by Matthews no Keynesian policies were applied during this period with government in a situation of budget surplus and policy being highly deflationary. This trend was interrupted by the slumpflation crisis around 1975.
Real incomes and investmentCoinciding with the termination of a more balanced income distribution in 1975, with the impacts of the international petroleum price shocks and slumpflation, the work giving rise to the real incomes approach to economics was initiated. This quest started out without preconceptions or agendas other than to try and understand why "conventional" macroeconomic policies of Keynesianism and monetarism no longer held the appropriate solutions because of the direct prejudicial impacts of these policies on the constituency. By 1976 this endeavour first uncovered the fact that there was a significant rift between what was available in terms of advancing state-of-the-art technologies and their general application. The prejudice referred to was policy-induced real income depressions and a widening income disparity. This is why this work took on the title of "The Real Incomes Approach" and why more recently is now a slogan: "RIO_Real Income Objective", to make clear that real incomes are the policy objective. In terms of constitutional economics the obvious sense is that this signifies raised real incomes for all. It is only in the last decade, following quantitative easing (QE) that we now see a gradual acknowledgement that
financialization has progressed too far since Nxon took the USA off the gold standard. Thorstein Veblen pointing out the nature of financialization as far back as 1921 well before the New York Stock Exchange Crash.
The line of enquiry in this short article is to trace the quality of investment, something which economic advisers appear to have forgotten about and which policy ignores.
Price earning ratiosDuring the growth period up to 1975, the price-earning ratios or PE provided the following pointers:
- A high PE ratio suggests that investors expect a high level of earnings in the future, and that growth will be strong. The share price has risen faster than earnings, on expectations of an improvement in performance
- A low PE ratio can arise as a share price falls while earnings remain broadly unchanged
|
Quantitative easing has seen some lead share prices rise by in excess of 25% each year while earnings have, in many cases, stagnated. This has led to very high PEs but rather than this being a sign of expectations of higher future earnings, the expectations are quite the reverse. Share buy backs have stimulated share prices while no equivalent sums of money have been invested to secure higher productivity. As a result output competitivity, in terms of the ability to moderate unit prices and penetrate markets under difficult circumstances, has been undermined. Therefore, corporate survival is an increasing uncertainty because even without input or cost-push inflation an increasing number of companies will not have the technical means to reduce their
price performance ratios to levels that will result in affordable output in a economy facing inflationary leakage from land and real estate asset markets and where a proportion of the constituency, for example, already pay 30% of their disposable incomes on mortgages or rental.
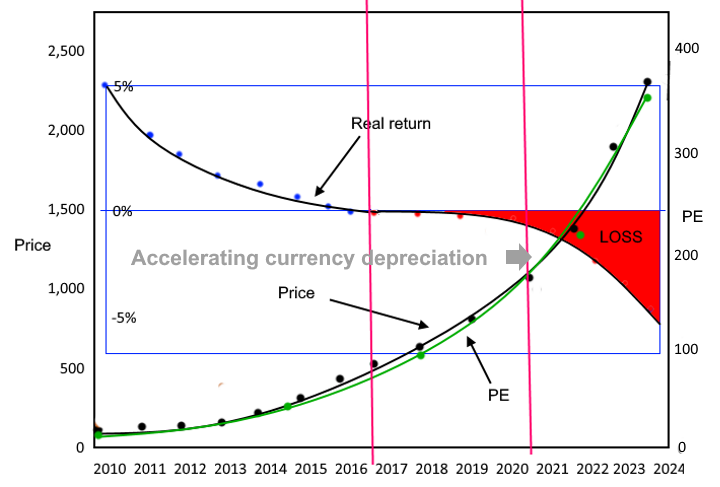
Projection of investment quality 2010-2024The combination of QE's impacts on investment and Covid-19 are combining to radically reduce the quality of investment and the real value of the currency and therefore real incomes. The table below traces the forward trend in investment quality and rising PEs and the impact on purchasing power of the currency leading to a fundamental decapitalization of the economy.
2010-2024
An acceleration of real investment quality declines (PE) and real decapitalization caused by depreciating real value of the currency
|
| Year | Share price | Earnings | PE | Inflation | δ Real income |
| 2010 | 100 | 6.5 | 15.4 | 1.5% | 5.0% |
| 2011 | 115 | 6.5 | 19.1 | 1.5% | 3.7% |
| 2012 | 156 | 6.5 | 24.0 | 1.5% | 1.7% |
| 2013 | 195 | 6.5 | 30.0 | 1.5% | 1.8% |
| 2014 | 144 | 6.5 | 37.5 | 1.5% | 1.1% |
| 2015 | 305 | 6.5 | 46.9 | 1.5% | 0.6% |
| 2016 | 381 | 6.5 | 58.7 | 1.5% | 0.1% |
| 2017 | 477 | 6.5 | 73.3 | 1.5% | -0.1% |
| 2018 | 596 | 6.5 | 91.7 | 1.5% | -0.4% |
| 2019 | 745 | 6.5 | 114.6 | 1.5% | -0.6% |
| 2020 | 931 | 6.5 | 143.1 | 1.5% | -0.8% |
| 2021 | 1,164 | 6.5 | 179.1 | 2.0% | -1.4% |
| 2022 | 1,455 | 6.5 | 113.8 | 3.0% | -1.6% |
| 2023 | 1,818 | 6.5 | 179.7 | 4.0% | -3.6% |
| 2024 | 1,173 | 6.5 | 349.7 | 5.0% | -4.7% |
|
SEEL-Systems Engineering Economic Lab (2020) |